Figure 3.

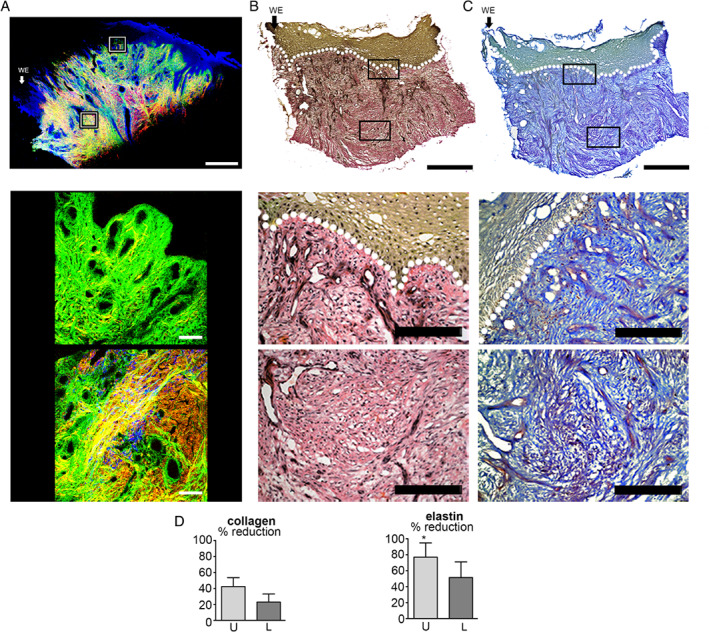
Imaging of the extracellular matrix of diabetic foot ulcer biopsies. (A) Second harmonic generation and autofluorescence imaging of collagen (green, backscatter; red, forward detection) and elastin fibres and nuclei (blue) in a diabetic foot ulcer. Montage of high‐power SHG and autofluorescence images of a 4‐mm skin biopsy from the edge of a diabetic foot ulcer. High‐power images of the upper and lower dermis. (B) Verhoeff van Gieson (VvG) staining collagen red and elastin black in a sister section. Montage followed by high‐power images of the upper and lower dermis. (C) Herovici staining differentiates between collagen type I, stained purple, and type III, blue. (D) Graphs quantifying SHG images and the % reduction in signal from collagen and elastin. Arrow and WE marks wound edge to the left of the image. Error bars: mean ± SEM. Scale bars, montage 1 mm and high power 200 µm.
