
Figure 1.
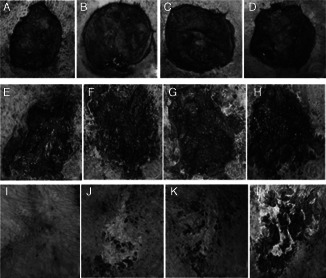
VSD results. (A–D): the −120 mmHg group, −180 mmHg group, −240 mmHg group and control group on the third day; (E–H): the −120 mmHg group, −180 mmHg group, −240 mmHg group and control group on the 16th day; (I–L): the −120 mmHg group, −180 mmHg group, −240 mmHg group and control group on the 30th day.