
Figure 6.
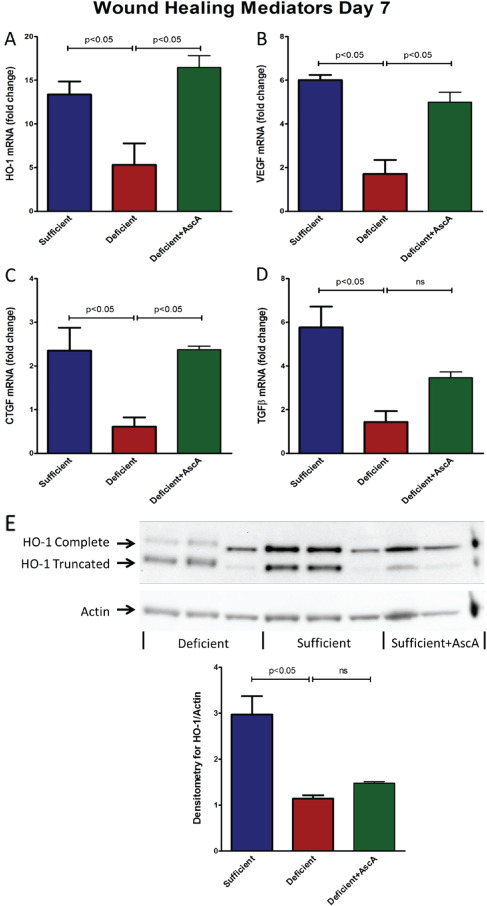
(A–D) Spatiotemporal profiling of HO‐1 and growth factors mRNA expression in day 7 wounds. Real time quantitative polymerase chain reaction (qPCR) for HO‐1 (A), VEGF (B), CTGF (C) and TGF‐β (D) mRNA from day‐7 wounds from vitamin C (VitC) sufficient, deficient, and deficient + AscA Gulo−/− mice (n = 3–6 mice/group, ns, not significant). (E): HO‐1 protein expression on day 7 post wounding. Representative Western blot for expression of HO‐1 and actin from day 7 wounds of VitC sufficient, deficient, and deficient + AscA Gulo−/− mice. The bar chart is a quantitative representation of the Western blot results using densitometry (n = 3–6 for each group, ns, not significant).