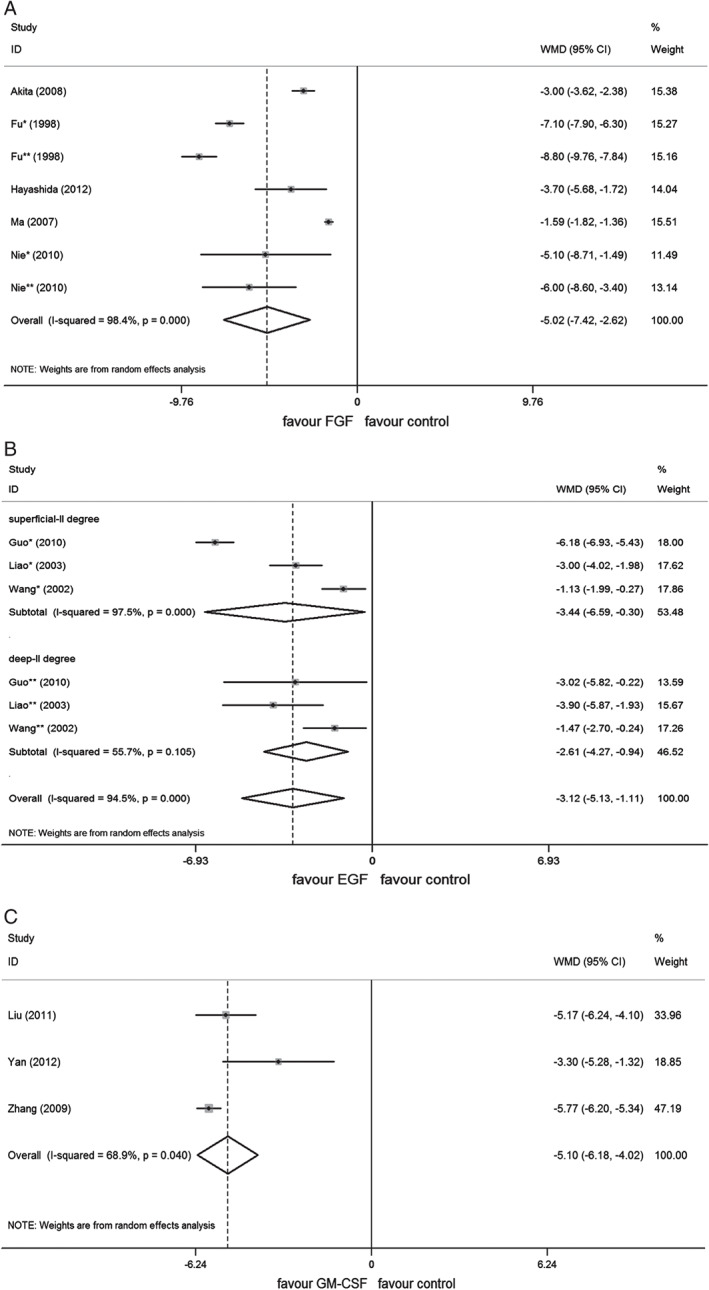
Figure 3.

Forest plot depicting the meta‐analysis of wound healing time between growth factors (GFs) versus control group. (A) Fibroblast growth factor (FGF), (B) epidermal growth factor (EGF), (C) granulocyte macrophage‐colony stimulating factor (GM‐CSF). CI, confidence interval; WMD, weighted mean difference; *, comparison of patients with IIa burns; **, comparison of patients with IIb burns.
