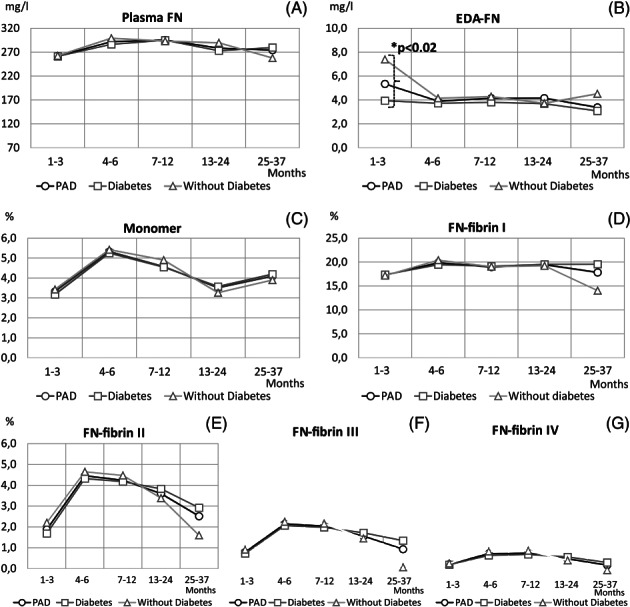
Figure 2.

Levels of FN molecular forms in plasma samples of PAD patients with respect to comorbid diabetes. Mean values of data: concentrations (mg/l) of plasma FN (A) and EDA‐FN (B); relative amounts (%) of FN monomer (C) and FN‐fibrin complexes I (D), II (E), III (F), and IV (G) of all PAD patients (—○—), PAD patients with diabetes (—□—), and PAD patients without diabetes (—Δ—) shown in relation to period after revascularisation: 1 to 3 months (diabetes: n = 42, without diabetes: n = 30), 4 to 6 months (diabetes: n = 49, without diabetes: n = 36), 7 to 12 months (diabetes: n = 98, without diabetes: n = 66), 13 to 24 months (diabetes: n = 120, without diabetes: n = 66), and 25 to 37 months (diabetes: n = 30, without diabetes: n = 12). *Significantly different between groups of PAD with comorbid diabetes and PAD with diabetes excluded
