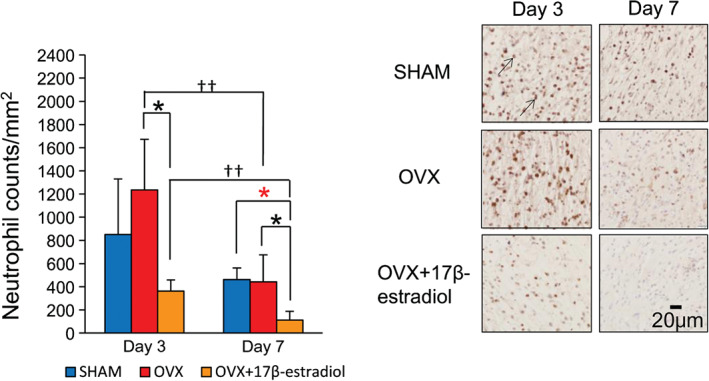
Figure 2.

Neutrophils. The number of neutrophils per mm2 is shown in box graphs. Neutrophils (arrows) stained with anti‐neutrophil antibody were observed in wound tissue on days 3 and 7. Bar, 40 µm. Values are expressed as mean ± SD, n = 4–5 for each group, ANOVA, t‐test or Tukey–Kramer *P < 0·05: OVX + 17β‐estradiol versus OVX; *P < 0·05: OVX + 17β‐estradiol versus SHAM; †† P < 0·01: day 3 versus day 7.
