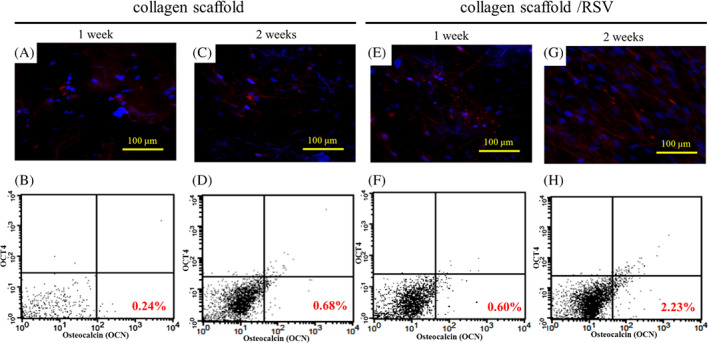
Figure 4.

The osteogenetic characteristics of hASCs grown in collagen scaffold and collagen/RSV for 1 and 2 weeks. (A, C, E, G) Immunofluorescent staining of Osteocalcian was visualised with the HiLyte Fluor 594‐labelled secondary antibody, which is shown in red. Nuclei that were counterstained with Hoechst 33 342 are shown in blue. (B, D, F, H) The flow cytometric analysis of embryonic stem cell‐associated protein expression and osteigenesis marker. Representative dot plots for the double staining of Oct‐4 and Osteocalcian. The fluorescence intensity of each FITC‐labelled Oct‐4 is not represented on the X‐axis; the percentages represent the bone differentiation of hASCs in each scaffolds
