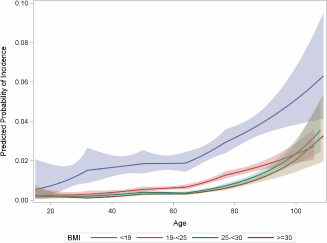
Figure 2.

Plot of probability of pressure ulcer (PU) incidence plotted against age by BMI group based on the interaction model (see text). Variables in the model are set at their mean [for Charlson Comorbidity Index (CCI), mean: 1·27] and at reference levels [surgical diagnosis‐related Groups (DRG), no; fiscal year, 2009, admit type, home]. Shaded regions depict point‐wise 95% confidence intervals for the probability of PU incidence.
