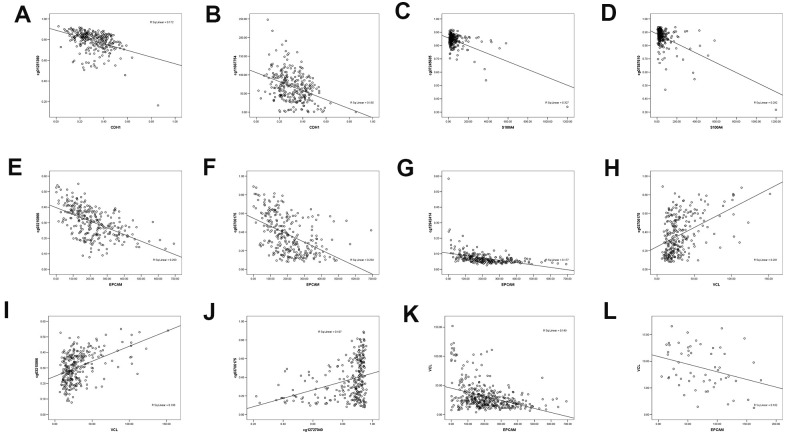
Figure 6.
The correlation between methylated sites and gene expression in gastric cancer patients. (A) Negative linear correlation between CDH1 and CDH1 DNA methylation site cg01251360. (B) Negative linear correlation between CDH1 and CDH1 DNA methylation site cg11667754. (C) Negative linear correlation between S100A4 and S100A4 DNA methylation site cg07245635. (D) Negative linear correlation between S100A4 and S100A4 DNA methylation site cg07587610. (E) Negative linear correlation between EPCAM and EPCAM DNA methylation site cg03210866. (F) Negative linear correlation between EPCAM and EPCAM DNA methylation site cg03706175. (G) Negative linear correlation between EPCAM and EPCAM DNA methylation site cg12942414. (H) linear correlation between VCL and EPCAM DNA methylation site cg03706175. (I) linear correlation between CDH1 and EPCAM DNA methylation site cg03210866. (J) linear correlation between VCL DNA methylation site cg12727040 and EPCAM DNA methylation site cg03706175. (K) Negative linear correlation between VCL and EPCAM expression. (L) Negative linear correlation between VCL and EPCAM expression in SYSU.

