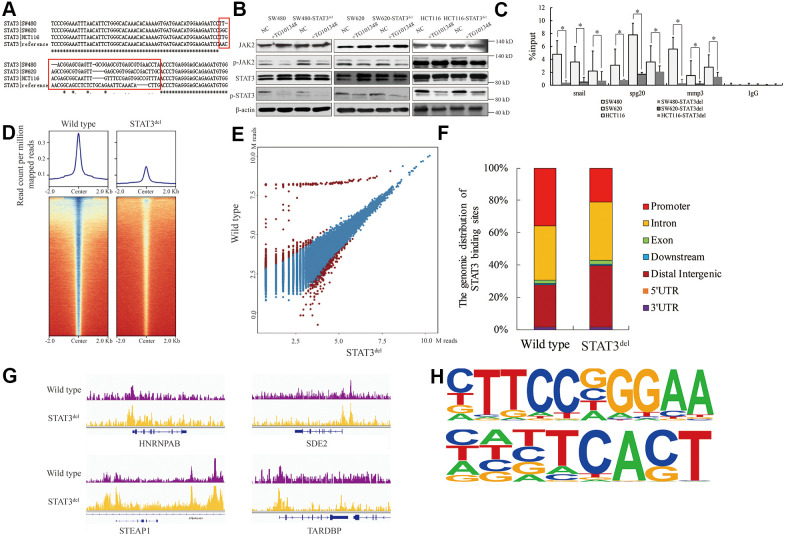
Figure 2.
The genomic binding pattern of STAT3del in colon cancer cells. (A) Sequence alignment shows the deletion of sequence encoding amino acid residues between 400 and 411 (NNGSLSAEFKHL) in the DNA-binding domain of STAT3 in the colon cancer cells (SW480, SW620, and HCT116) using CRISPR-CAS9. (B) Representative western blot shows the total and phosphorylated levels of JAK2 and STAT3 in control and TG101348 (JAK2 inhibitor)-treated wild-type and STAT3del SW480, SW620, and HCT116 cells. Βeta-actin is shown as the loading control. Each experiment was performed in triplicates. (C) ChIP-qPCR results show the occupancy of STAT3del in the promoter regions of Snail, Spg20 and MMP3 genes in SW480, SW620, and HCT116 cells with wild-type STAT3 or STAT3del. * denotes p < 0.05. Each experiment was performed in triplicate. (D) The heatmap shows the genome-wide occupancy of STAT3 and STAT3del at all the annotated gene promoters in the SW480 cells as determined by ChIP-seq. The average STAT3 enrichment is measured based on the log2 (peak p values) in 200-bp bins and is shown within genomic regions covering 2 kb upstream and downstream of the center. (E) The volcano plot shows the comparison of different peaks (representing STAT3 genomic occupancy) between wild type and STAT3del SW480 cells. Brown spots represent significantly altered peaks between STAT3 and STAT3del; blue spots represent peaks without statistical significance. (F) The genome-wide distribution of STAT3 binding regions in wild-type and STAT3del SW480 cells. The various genomic regions are represented by different colors. (G) Enrichment of STAT3 (purple) or STAT3del (yellow) in the HNRNPAB, SDE2, STEAP1, and TARDBP genes. ChIP-seq data are shown in reads per million; y-axis floor is set to 0.5 reads per million. (H) Predicted DNA-binding motifs that are enriched in the loci bound by wild type STAT3 (top) and STAT3del (bottom) in the SW480 cells.

