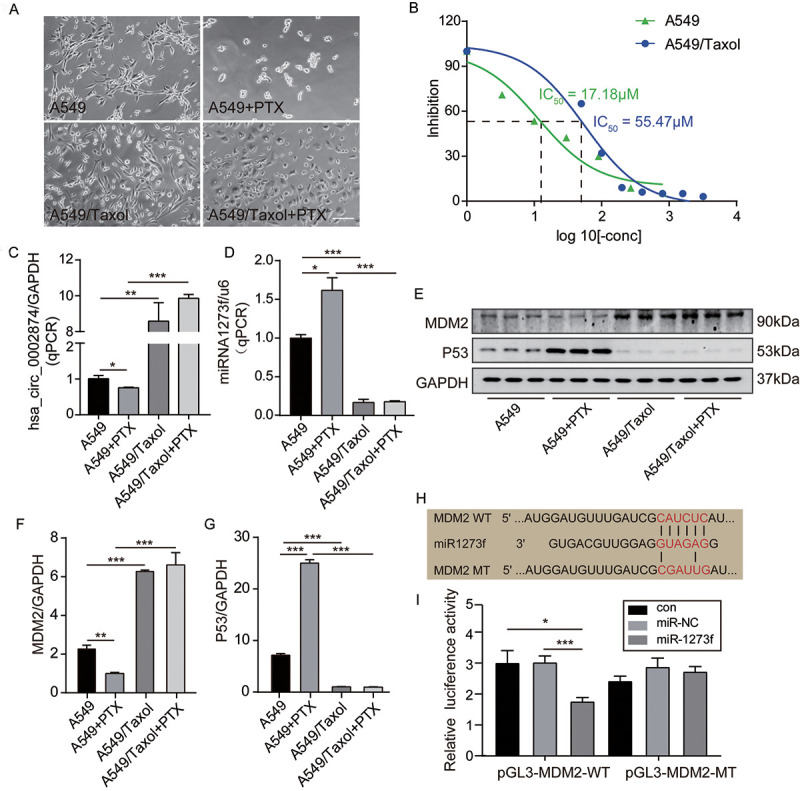
Figure 2.

PTX downregulated the expression of hsa_circ_0002874 and MDM2 while upregulated the expression of miR1273f and P53 in A549 cells. (A) Cell morphology of A549 and A549/Taxol cells following 10μM PTX administration for 48h (images acquired at 10× magnification). (B) A549 or A549/Taxol cells viability was measured by MTT assay after the treatment of different concentrations of PTX. (C) hsa_circ_0002874 expression was determined by qPCR method after 10μM PTX administration for 48h in A549 and A549/Taxol cells. (D) miR1273f expression was determined by qPCR method after 10μM PTX administration for 48h in A549 and A549/Taxol cells. (E) MDM2 and P53 expression were determined by western blot after 10μM PTX administration for 48h in A549 and A549/Taxol cells. (F) The quantification of MDM2 protein was analyzed according to bands in Figure 2E. (G) The quantification of P53 protein was analyzed according to bands in Figure 2E. (H) Sequence alignments between miR1273f and the seed sequence of MDM2. WT and MT represent wild-type and mutant sequences of MDM2. (I) Results of the dual-luciferase reporter gene assay in 293 cells. *p <0.05, **p <0.01, ***p <0.001, n=3 in each group. Scale bar=100μm.
