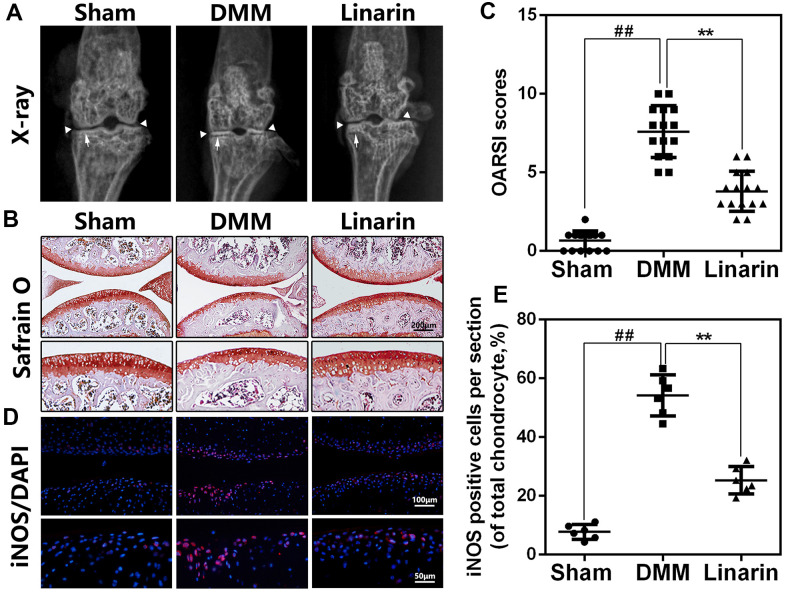
Figure 6.
Linarin attenuates OA development in vivo. (A). Digital X-ray image of mouse knee joints from different experimental groups. Narrowing of joint space was found in both OA and treatment group (white triangles), the calcification of cartilage surface was obviously shown in OA group (white arrows). (B). Representative S-O staining of cartilage from different experimental groups at 8 weeks post-surgery (scale bar: 200 μm). (C). Diagrams showed the OARSI scores of cartilage. (D, E) The immunofluorescence staining of iNOS in mouse knee articular cartilage (scale bar: 20 μm). The data in the figures represent the averages ± S.D. Significant differences among different groups are indicated as ##P<0.01, **P<0.01.

