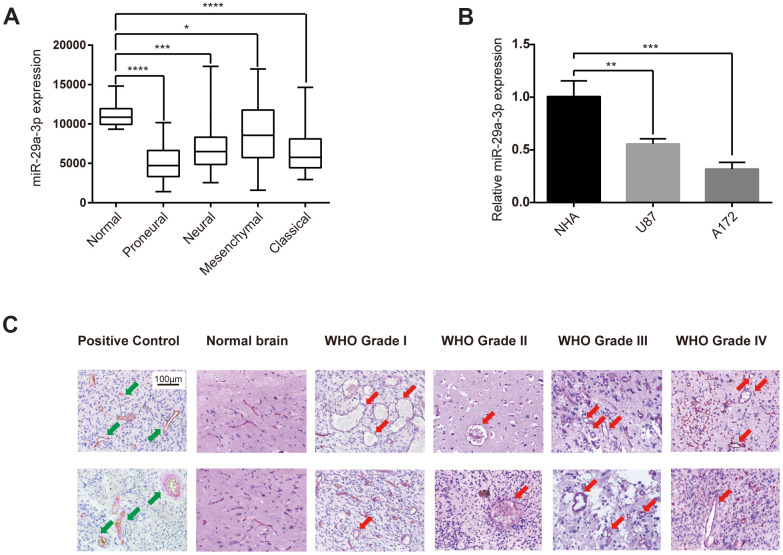
Figure 1.
Glioma formed VM structures and showed aberrantly low expression level of miR-29a-3p. (A) Quantification of miR-29a-3p expression levels in gliomas of different subtypes in the TCGA database. Data are shown as the mean±SD, n=204, one-way ANOVA (*, P < 0.05). (B) miR-29a-3p expression in NHA, U87 and A172 cells. Data are shown as the mean±SD, n=3, one-way ANOVA (*, P < 0.05). (C) Representative images of CD34-PAS IHC staining of VM structures (red arrows; scale bar, 100 μm) in normal brain specimens (n=2) and in gliomas of different grades (n=45). Epithelium-lined vessels (CD34+/PAS+) were set as positive control (green arrows; scale bar, 100 μm).

