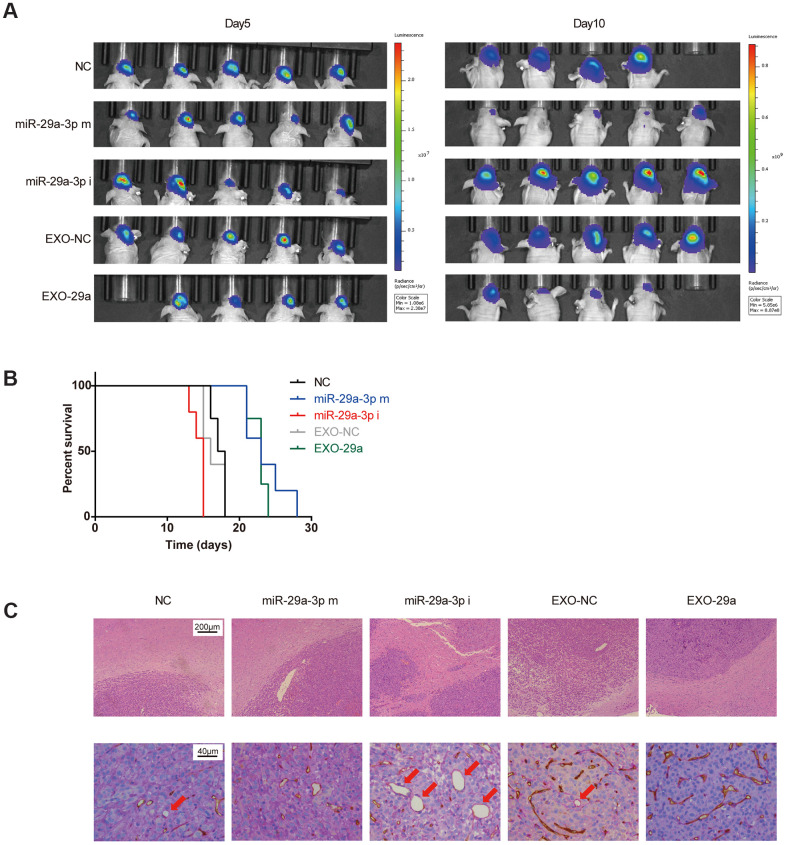
Figure 5.
Effects of exosomes overexpressing miR-29a-3p resembled the anti-glioma effects of miR-29a-3p overexpression in vivo. (A) Bioluminescence imaging showed the tumour sizes on day 5 and day 10 after transplantation. (B) Kaplan–Meier survival curves for animals in different groups (miR-29a-3p m VS NC, p=0.0040; miR-29a-3p i VS NC, p=0.0074; EXO-29a VS NC, p=0.0091; EXO-29a VS EXO-NC, p=0.0060; EXO-NC VS NC, p=0.5433; log-rank test; n=23). (C) Representative images of the tumour/brain border with HE staining (upper panels; scale bar, 200 μm) and CD34-PAS IHC staining of VM structures (lower panels, red arrows; scale bar, 40 μm).

