
Figure 6.
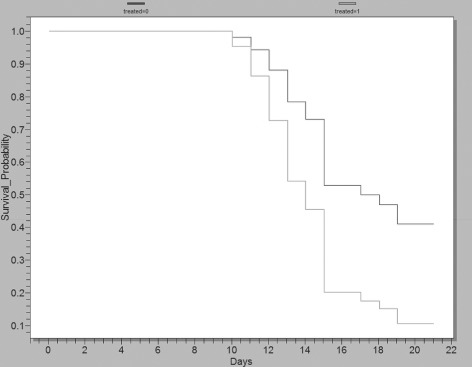
Cox proportional hazard regression plot investigating likelihood (survival probability) of wound closure over time in nitric oxide gas (gNO)‐producing patch‐treated wounds versus wounds treated with vehicle control patches independent of covariables. These data show that gNO‐producing probiotic patch‐treated wounds are 2·52 times more likely to close compared with wounds treated with vehicle control patches (hazard P = 0·038, score P = 0·032 and likelihood ratio P = 0·036) and that several non treated wounds remained open. The light line represents gNO‐producing probiotic patch‐treated wounds (16 wounds) and the dark grey line represents wounds treated with vehicle control patches (16 wounds). These data were graphed using EpiInfo software (Center for Disease Control).