
Figure 8.
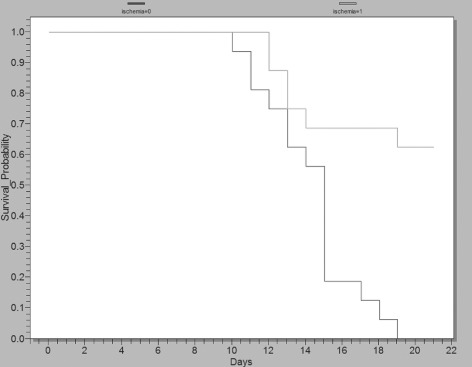
Kaplan–Meier plot showing the likelihood (survival probability) of wound closure over time for ischaemic wounds versus non ischaemic wounds. These data show that ischaemia delays wound closure (log‐rank P = 0·005 and Wilcoxon P = 0·0056) and that some ischaemic wounds remain open at 21 days. The light grey line represents ischaemic wounds (16 wounds), whereas the dark grey line represents non ischaemic (16 wounds). These data were graphed using EpiInfo software (Center for Disease Control).