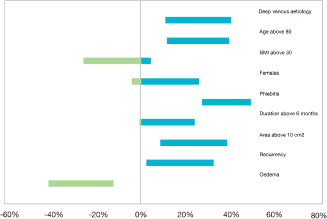
Figure 3.

Differences in distribution of baseline characteristics (France versus all others) given as 95% CI. The figure illustrates, for each dichotomous characteristic (such as ‘deep venous aetiology’ or ‘age above 80’), the difference between the percentages of French and ‘all other’ subjects with that is ‘age above 80’. The difference can, in principle be anything between −100% and 100%. The difference is equipped with a 95% confidence bar, centred at the observed difference. If the bar is monochrome, red or blue, one group (France or ‘all others’) has a larger prevalence than the other. A red bar shows that a given characteristic is significantly more frequent in France, whereas a blue marks that a given characteristic is statistically more frequent in the group of ‘all others’. The mixed coloured bar indicates that the difference between the groups is non significant.
