
Figure 2.
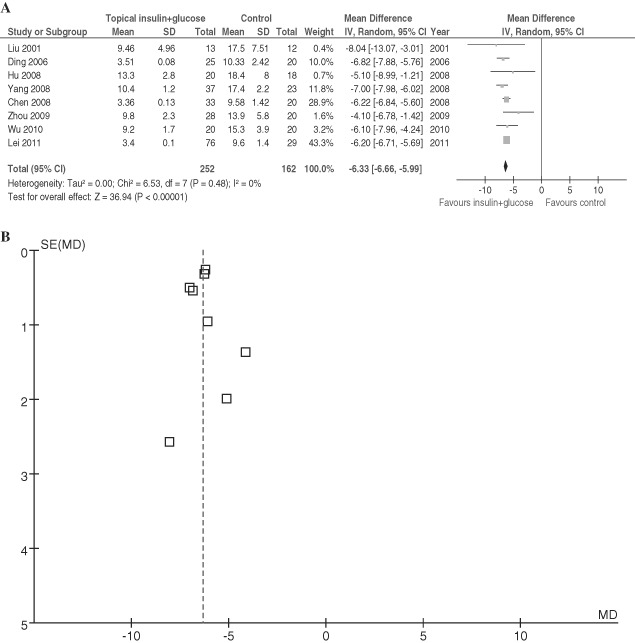
Comparison of subcutaneous injection of insulin with hypertonic glucose and conventional drainage in postoperative patients with incision fat liquefaction. (A) Forest plot. (B) Funnel plot of enrolled studies for A. Vertical line indicates no difference between compared treatments. Horizontal lines show 95% CIs. Squares indicate point estimates, and the size of the squares indicates the weight of each study in the meta‐analysis. IV Random, random‐effects inverse variance model; CI, confidence interval.