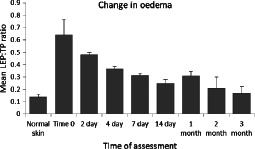
Figure 3.

Analysis of changes in levels of oedema in periwound tissue of pressure ulcers during gauze‐based negative pressure wound therapy (NPWT) at−80 mmHg. Histogram of mean (±SEM) Low echogenic pixel:total pixel (LEP:TP) ratio against time of NPWT (n = 4: normal skin, time 0, days 2, 4, 7; n = 3: day 14, 1 month; n = 2: 2 months, 3 months).
