
Figure 2.
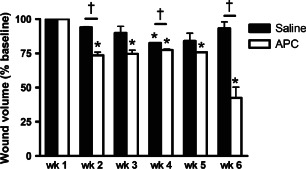
Wound volumes for saline‐ and activated protein C‐treated groups. Data expressed as mean ± standard error of the mean. *p < 0·05, repeated‐measures analysis of variance with Newman‐Keuls post‐hoc analysis; † p < 0·05, unpaired Student t‐test.