
Figure 4.
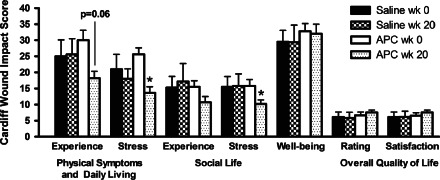
Cardiff Wound Impact Schedule scores from saline‐ and activated protein C‐treated groups at week 1 and week 20. Data expressed as mean ± standard error of the mean, where lower scores indicate improved quality of life. * p < 0·05, paired Student t‐test.