
Figure 3.
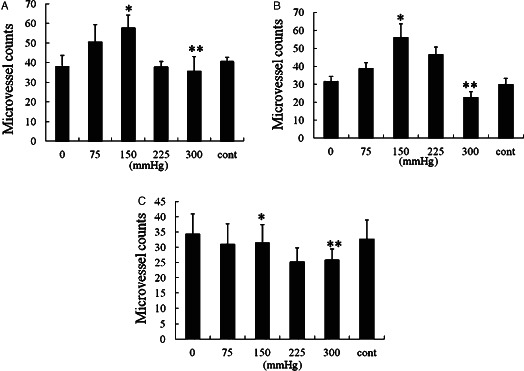
Microvessel counts of granulation tissues. On days 3 (A) and 5 (B), * shows that there are significantly higher microvessels in vacuum‐assisted closure (VAC) of 150 mmHg than in VAC of 300 mmHg (P < 0·05) and control (P < 0·01). The symbol ** shows that there is no significant difference between VAC of 300 mmHg and control (P > 0·05). On day 7 (C), * shows that there is no significant difference between VAC of 0 mmHg and control, and VAC of 150 mmHg is notably higher than that of 300 mmHg (P < 0·05). The symbol ** shows that VAC of 300 mmHg is significantly less than control (P < 0·05).