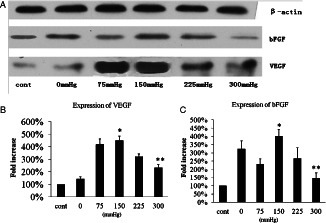
Figure 6.

Western blot for vascular endothelial growth factor (VEGF) and basic fibroblast growth factor (bFGF) on day 5 (A). (B) Expression of VEGF. The symbol * shows that the expression of VEGF in vacuum‐assisted closure (VAC) of 150 mmHg is significantly higher than VAC of 300 mmHg and control (P < 0·05); ** shows that the expression of VEGF in VAC of 300 mmHg is less than 225 mmHg (P < 0·05), but notably higher than control (P < 0·05). (C) The expression of bFGF; * shows that there is significant difference between VAC of 150 and 300 mmHg and control; ** shows that there is no significant difference between VAC of 300 mmHg and control. But the expression of bFGF in VAC of 300 mmHg is less than in VAC of 225 mmHg.
