
Figure 3.
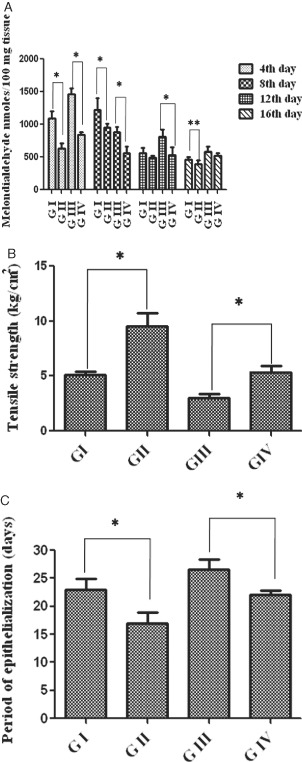
(A) Lipid peroxides of wound tissues on various days. Values are expressed as mean ± standard deviation (SD) for six animals and level of significance is expressed as * P < 0·05, respectively, compared with the corresponding control. (B) Tensile strength of incision wounds from control and treated rats. Values are expressed as mean ± SD for six animals, * P < 0·01. (C) Period of epithelialisation (measured as the number of days required for complete healing) in control and treated rats. Values are expressed as mean ± SD for six animals, * P < 0·01.