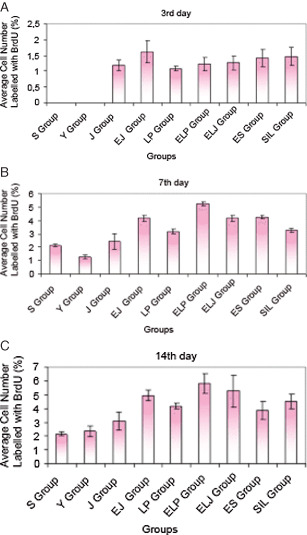
Figure 4.

The average cell number labelled with BrdU (A) at the 3rd day of the treatment for the different groups (%) (n = 4) (all groups with each other: P > 0·05); (B) at the 7th day of the treatment for the different groups (%), (n = 4) (S‐Y, EJ‐ELJ, EJ‐ES, ELJ‐ES: unsignificant, others: P < 0·001); (C) at the 14th day of the treatment for the different groups (%), (n = 4) (S‐EJ, S‐LP, S‐ELP, S‐SİL, S‐ELJ, S‐ES, Y‐EJ, Y‐LP, Y‐ELP, Y‐SİL, Y‐ELJ, Y‐ES, J‐EJ, J‐ELP, J‐ELJ, LP‐ELP, ELP‐ES: P < 0·001, others: unsignificant).
