
Figure 6.
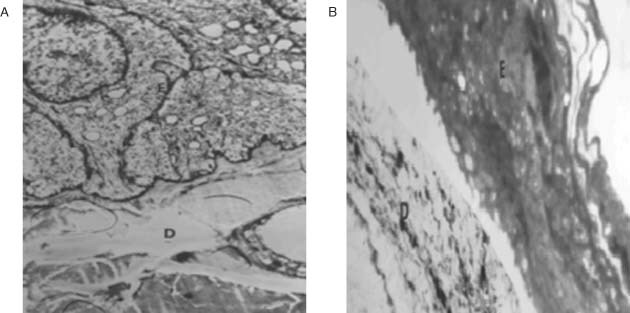
The microscopic image of the epidermis and dermis from the different experimental groups: (A) healthy group, (B) untreated group, at the 14th day of the treatment. E: Epidermis, D: Dermis (×3000).
Official websites use .gov
A
.gov website belongs to an official
government organization in the United States.
Secure .gov websites use HTTPS
A lock (
) or https:// means you've safely
connected to the .gov website. Share sensitive
information only on official, secure websites.
The microscopic image of the epidermis and dermis from the different experimental groups: (A) healthy group, (B) untreated group, at the 14th day of the treatment. E: Epidermis, D: Dermis (×3000).