
Figure 1.
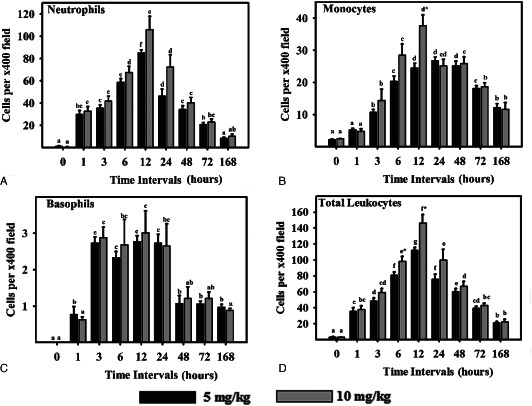
Leukocyte response in sulphur mustard (SM) (5 or 10 mg/kg diluted in acetone) exposed mouse skin at various time intervals. Same alphabets on bars indicate non‐significant (P < 0·05) difference between time intervals at same dose shown with the same colour bar. Asterisks indicate significantly (P < 0·05) higher values in 10 mg/kg as compared to 5 mg/kg at given time intervals and for given parameter (n = 6)