
Figure 10.
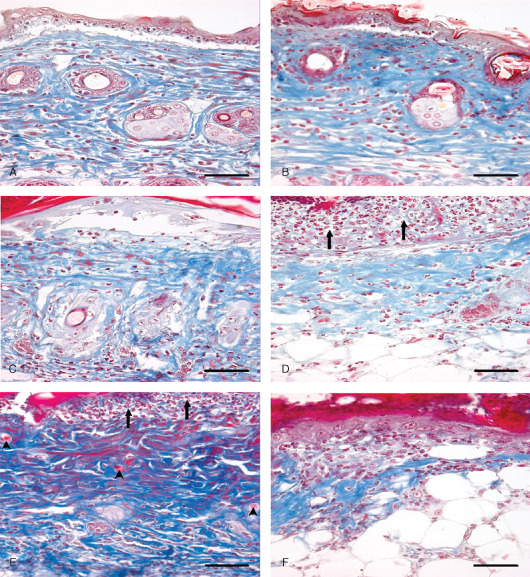
Photomicrograph of sulphur mustard (SM) (5 or 10 mg/kg) treated mouse skin sections taken at various time intervals. Masson trichrome. Bar = 25 µm. (A) 12 hours (SM 5 mg/kg) showing dermoepidermal separation, oedema and blue‐stained sparse arrangement of collagen along with monocytoid cell infiltration. (B) 12 hours (SM 10 mg/kg) showing dermoepidermal separation, necrosis of epidermal cells and oedema. Severity of lesions was more compared to (A). (C) 72 hours (SM 5 mg/kg) showing decreased collagen content compared to the 12‐hour stage. (D) 72 hours (SM 10 mg/kg) showing decreased collagen content compared to the 12‐hour stage and 72 hours of SM (5 mg/kg). Severe epidermal necrosis (arrow) (E) 168 hours (SM 5 mg/kg) showing necrosis of epidermis (arrow), proliferation of fibroblast (deep blue colour) and neoangiogenesis (arrow head). (F) 168 hours (SM 10 mg/kg) showing eschar tissue covering the ulcer, with minimal dermal tissue (blue) atrophied adnexa and transmigrated inflammatory cells.