
Figure 7.
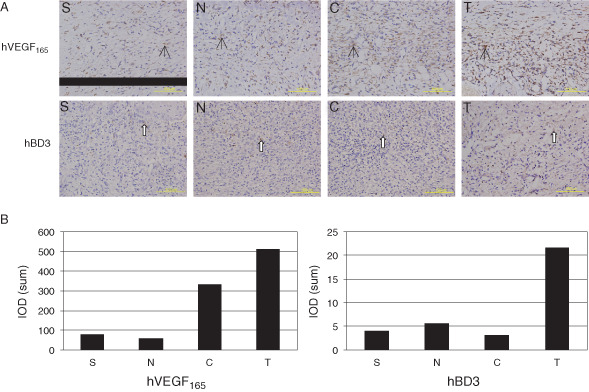
Immunohistochemical studies revealed hVEGF165/hBD3 expression in the granulation tissue on day 7 after injury. (A) Upper panels: the hVEGF165 expression (black arrows) was strong in groups T and C. Lower panels: the hBD3 expression (white arrows) was strong in group T. Bars = 100 µm. (B) Images were analysed for quantifying hVEGF165/hBD3 expression in granulation tissue.