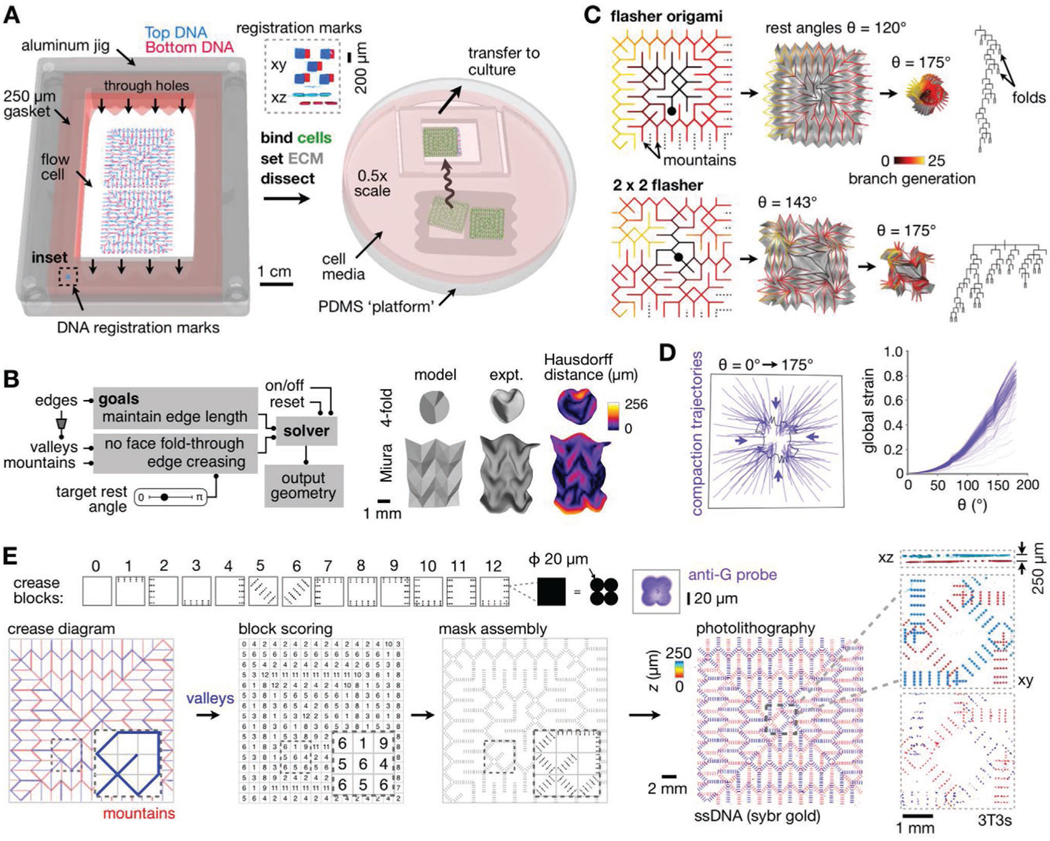
Figure 2.

Large-scale model-guided design and production of kinomorphs. A) Schematic of microfluidic flow cell workflow and transfer of kinomorphs to culture. Inset, SYBR Gold-labeled slide registration marks (Supporting Information). B) Left: Flow chart outlining origami simulation of crease networks. Right: Simulated 3D surfaces versus experimentally generated kinomorphs based on classic fourfold and Miura origami crease networks (partly reproduced with permission.[35] 2018, Cell Press). Experiment kinomorphs are also shown shaded by Hausdorff distance to models. C) Origami simulations for flasher (top) and 2 × 2 tessellated flasher (bottom) crease networks. Left: Crease networks for mountain folds color-coded by number of branch generations from a given crease to center points (black circles). Middle: Simulations at different crease rest angles (θ), including associated sheet surfaces in gray. Right: Branch patterns describing crease networks. D) Left: Trajectories following the movement of several locations on a 2 × 2 flasher model as θ increases from 0° to 175°. Right: Plot of global strain measured for each trajectory. E) Top row: Crease blocks where each black pixel encodes a 2 × 2 grid of 20 μm-diameter circular features. Right: Confocal fluorescence microscopy image of an anti-G-FITC-probed feature associated with one crease block pixel. Bottom row: Flasher origami crease diagram showing valleys (blue) and mountains (red), manual crease scoring to ascribe crease blocks, and block assembly into full mask design. Right: Confocal fluorescence microscopy images of SYBR gold-labeled DNA features on a pair of assembled pDPAC substrates, color-coded by depth. Insets: Detail and xz projection of DNA features and CellTracker dye-labeled 3T3 cells, also color-coded by z depth.
