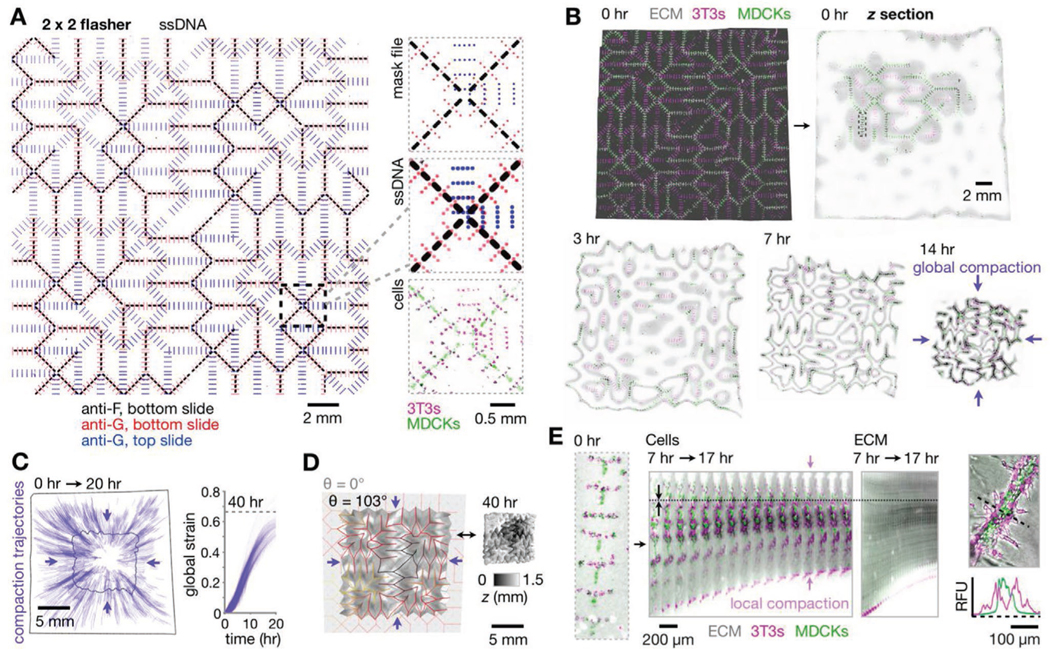
Figure 3.

Kinomorphs shepherd cell cluster fusion through controlled local and global compaction. A) Left: Fluorescence microscopy image of assembled pDPAC substrates after patterning with a 2 × 2 flasher design (specifying 3T3 patterning sites using G and MDCK sites using F ssDNAs) and stained with anti-G- and anti-F-FITC probes. Right: Detail of mask design, fluorescence z-projections of corresponding DNA features, and H2B-FP-expressing 3T3/MDCK cells. B) Confocal fluorescence z-projection of the kinomorph imaged immediately after release into media, and mid-plane z sections from a subsequent time-lapse experiment during its compaction in culture. C) Left: Trajectories following the movement of several locations on the kinomorph over 0–20 h. Right: Plot of global strain for each trajectory. D) Left: Output from an origami simulation chosen to match the degree of folding (see Supporting Note 1, Supporting Information) of the kinomorph after 40 h in culture (shown on the right as a 3D rendering shaded by z-height). E) Left: Fluorescence microscopy image of cells patterned at a single crease, kymograph of the crease over a period of 7–17 h after the kinomorph was placed in culture, and kymograph of an ECM region immediately adjacentto cells within the same crease. Note axial compaction of cells and ECM toward a stationary position in the image (dotted line). Right: Relative fluorescence traces across a tubule section show basal 3T3 localization.
