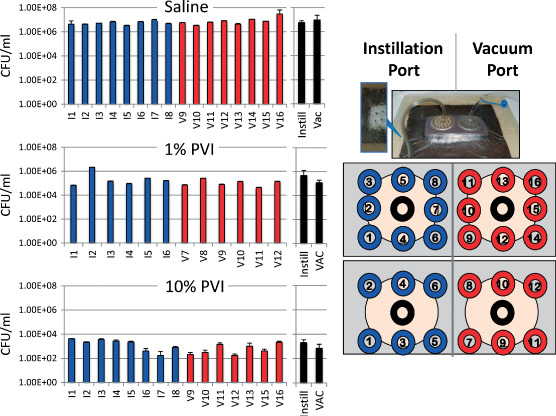
Figure 3.

Bacterial load relative to biopsy position. Multiple biopsies from all trials were collected to determine if bacterial burden is influenced by position relative to the vacuum or instillation ports. Data from single experiments (trials) are shown here as representative examples. The data generated from a trial after 1% and 10% povidone iodine (PVP‐I) instillation is representative of this observed trend of slightly lower bacterial burden near the vacuum port, which was not observed with any of the saline instillation trials. The blue bars are results from biopsies collected under the instillation port and the red bars are results from biopsies collected under the vacuum port. The black bars are the means and standard deviations of the multiple samples collected from under the instillation port (Instill) or vacuum port (Vac).
