Figure 3.

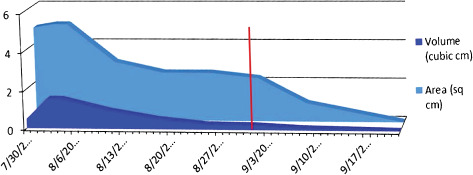
A graph plotting wound size over time (red line represents application of dHAM on 1 September 2010). Area is in square cm, volume is in cubic cm. Both parameters improved until resolution from the plateau seen before dHAM application.

A graph plotting wound size over time (red line represents application of dHAM on 1 September 2010). Area is in square cm, volume is in cubic cm. Both parameters improved until resolution from the plateau seen before dHAM application.