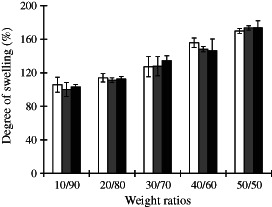
Figure 3.

Degree of swelling (%) of CS/PVA nanofibre mats with different weight ratios; ( ) CS‐HOBt/PVA, (
 ) CS‐TPP/PVA and (
 ) CS‐EDTA/PVA. The data are expressed as mean ± standard deviation (n = 3).

Degree of swelling (%) of CS/PVA nanofibre mats with different weight ratios; ( ) CS‐HOBt/PVA, (
 ) CS‐TPP/PVA and (
 ) CS‐EDTA/PVA. The data are expressed as mean ± standard deviation (n = 3).