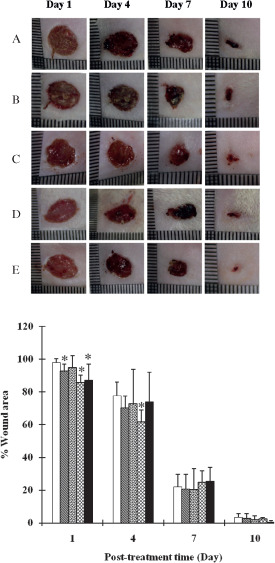
Figure 6.

Appearance of would healings and wound area (%) at 1, 4, 7 and 10 day after the treatment with (A,  ) gauze (negative control), (B,
  ) 30/70 CS‐HOBt/PVA nanofibre mats, (C,
  ) 30/70 CS‐TPP/PVA nanofibre mats, (D,
  ) 30/70 CS‐EDTA/PVA nanofibre mats and (E,
  ) commercial antibacterial gauze dressing (Sofra‐tulleregister) (positive control). Difference values * were statistically significant (P < 0·05) compared with gauze. The data are expressed as mean ± standard deviation (n = 6).
