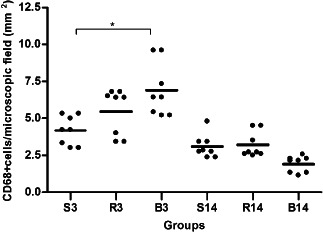
Figure 4.

CD68 expression on day 3 (S3, R3 and B3) and day 14 (S14, R14 and B14); (S,R,B) saline, bupivacaine and ropivacaine. ∗ P < 0·05. The lines represent the mean values ± SEM for the three treatment groups and the individual data points are represented by dots above and below the mean value.
