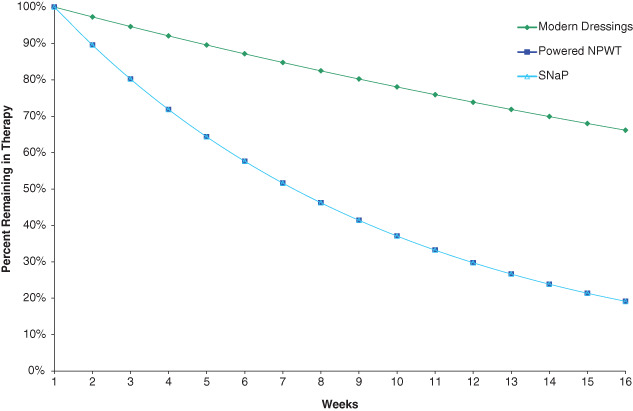
Figure 1.

Fraction of patients remaining in therapy over the course of 16 weeks. Projected Kaplan–Meier curve showing the fraction of patients remaining on therapy. The lines compare the three treatment choices. The lines for powered negative pressure and SNaP are superimposed because of equal effectiveness.
