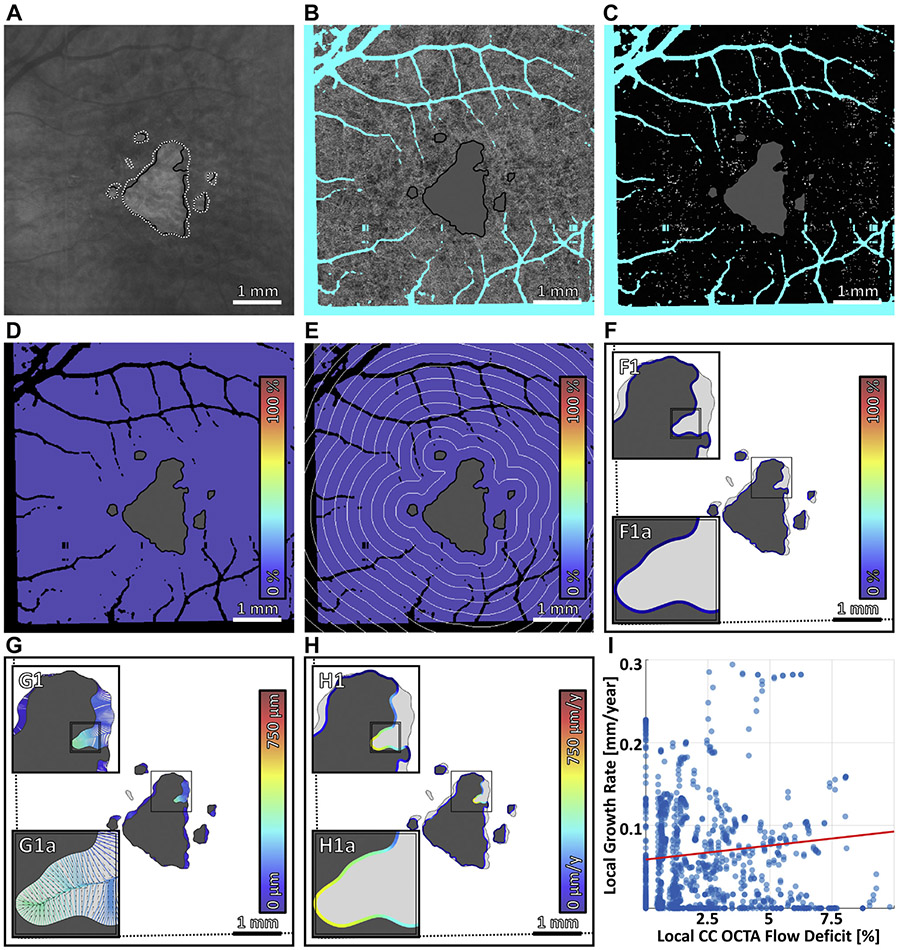
FIGURE 4.
Multiscale analysis of choriocapillaris (CC) impairment and geographic atrophy (GA) growth in case 1, the slowest growing multifocal lesion. (A) Baseline sub–retinal pigment epithelium optical coherence tomography angiography (OCTA) slab. The baseline and follow-up GA margins are delineated by the solid black and dashed white contours, respectively. (B) Baseline CC OCTA slab (1.5-ms interscan time). Artifacts are shown in teal and are excluded from analysis (see Figure 2B); the region of baseline GA is colored gray, and is also excluded from analysis. (C) CC flow deficit image, formed by binarizing the CC OCTA slab of panel B (white pixels indicate flow deficits). (D–F) Flow deficit percentage analyzed at global, zonal, and local scales, respectively (see Figure 2). (G) Growth trajectories. (H) Local growth rates. (I) Scatterplot of the local growth rate of panel H vs the local CC impairment of panel F, with linear regression line (red). Note that the x axis scale differs for Figure 4-7.

