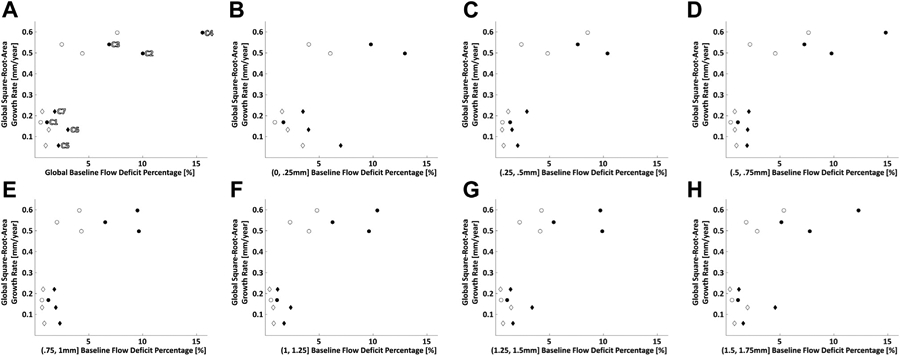
FIGURE 8.

Scatterplots of global geographic atrophy (GA) growth rate vs global and zonal baseline choriocapillaris (CC) impairment. (A) Scatterplot of global GA growth rate vs global baseline CC flow deficit percentage. (B–H) Scatterplots of global GA growth rate vs zonal baseline CC flow deficit percentage in 250-μm-wide zones; each scatterplot corresponds to zones located at a particular distance away from the GA margin, as specified by the x axis labels. For all plots, circular markers indicate multifocal lesions and diamond markers indicate unifocal lesions; filled markers correspond to 1.5-ms interscan time CC optical coherence tomography angiography (OCTA) slabs, and open markers correspond to 3.0-ms interscan time CC OCTA slabs. In panel A, cases 1 through 7 are labeled C1 through C7, respectively.
