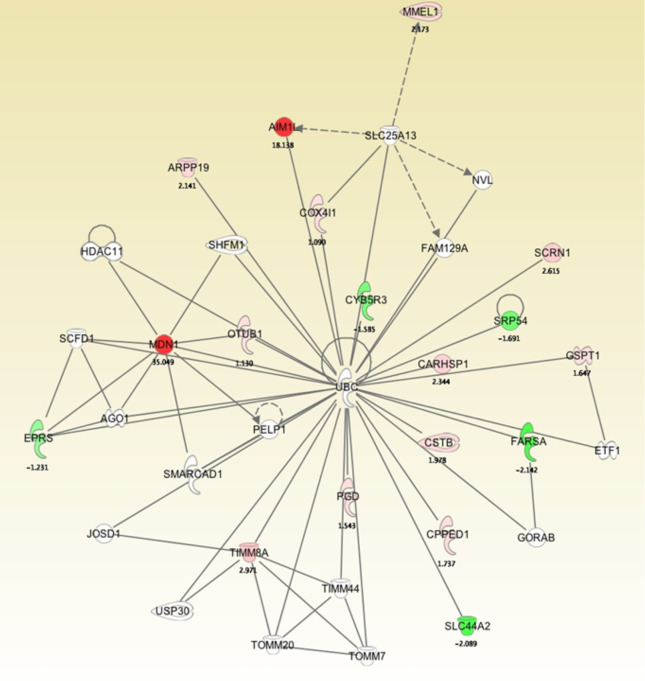
Figure 4.
Molecular pathway and network analysis of proteomics analysis of differentially expressed proteins in LTLT-Ca mammospheres and LTLT-Ca adherent cells. The proteome data was uploaded into IPA software that determined a network view of predicted associations for midasin. The network nodes represent proteins, and solid lines indicated a direct relationship while dashed lines represent an indirect relationship between proteins.

