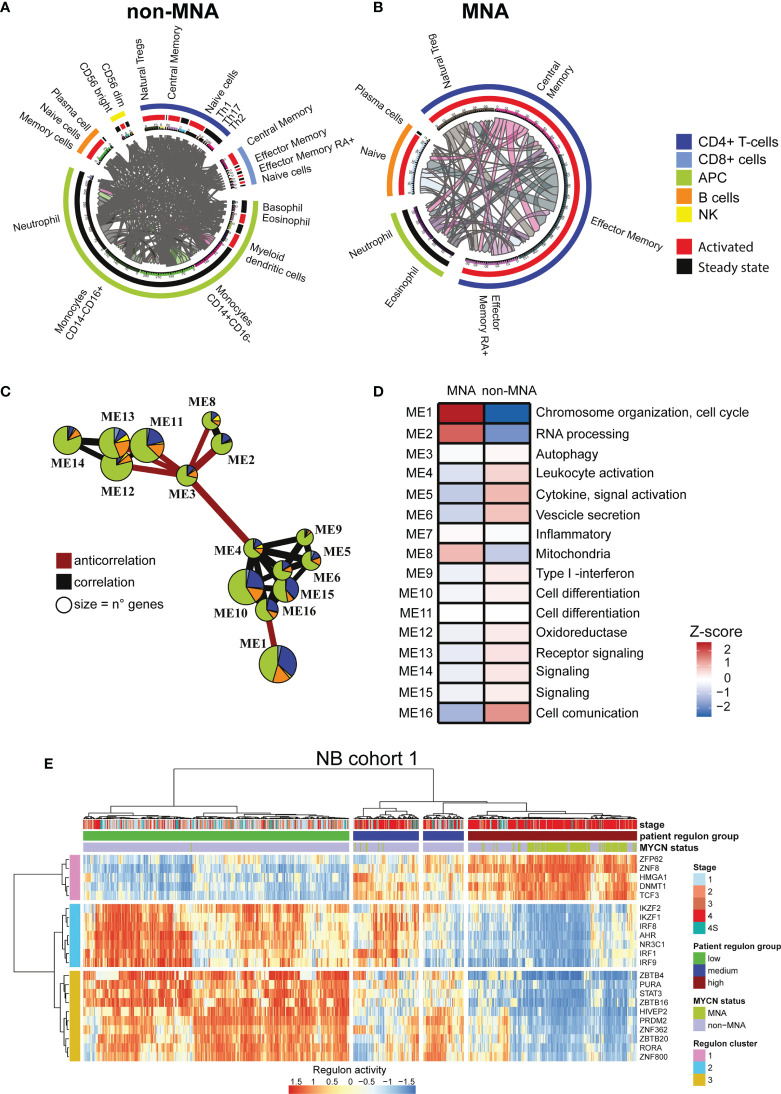
Figure 2.
MYCN up-regulation impacts a wide immune interaction network. (A, B) Circular plots. Immune subpopulations are specified outside the circle, outer circle represents cell types, inner circle represents activation status. Connecting lines indicate connection between two subpopulations and are proportional to the number of connections. (A) Immune network in non-(MYCN amplification) MNA patients. (B) Immune network in MNA patients. (C) Immune system gene module network in neuroblastoma (NB). Edges size is proportional to Pearson correlation coefficients, correlation is indicated in gray and negative correlation in red. Modules with no connections are not shown, module size is proportional to the number of genes within. Pie chart colors correspond to immune cell types, the size of the slices corresponds to the number of the genes. (D) Heatmap of MNA and non-MNA patient gene expression profiles (MNA = 122, non-MNA = 580) in NB1 cohort (E-MTAB-1781). Color intensity is proportional to z-score of the average eigengenes for each gene module. Main pathway enrichment for each module is listed on the left, full list is present in the Supplementary Tables. (E) heatmap representing the normalize relative abundance of regulons in NB1 cohort (E-MTAB-1781). Hierarchical clustering is conducted on the row and the columns using the Euclidean distance. Clinical data are on top.

