
Figure 2. Aggression Model with Path Coefficients.
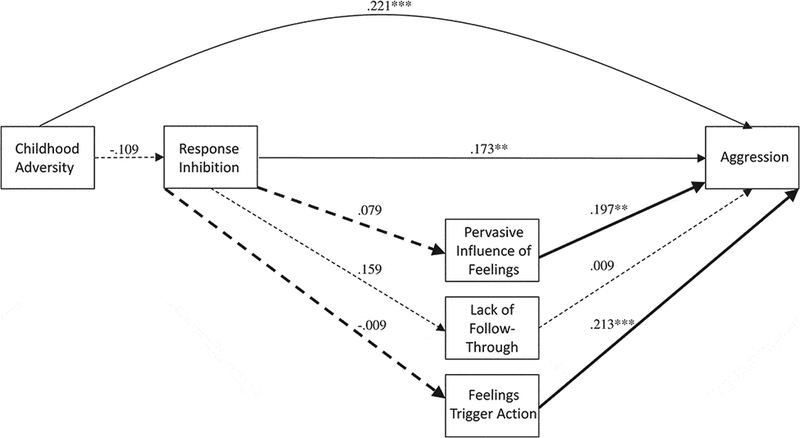
Note. Dashed lines represent non-significant pathways. Bold lines represent emotion-relevant pathways. * p < .05 ** p < .01 *** p < .001
Official websites use .gov
A
.gov website belongs to an official
government organization in the United States.
Secure .gov websites use HTTPS
A lock (
) or https:// means you've safely
connected to the .gov website. Share sensitive
information only on official, secure websites.
Note. Dashed lines represent non-significant pathways. Bold lines represent emotion-relevant pathways. * p < .05 ** p < .01 *** p < .001