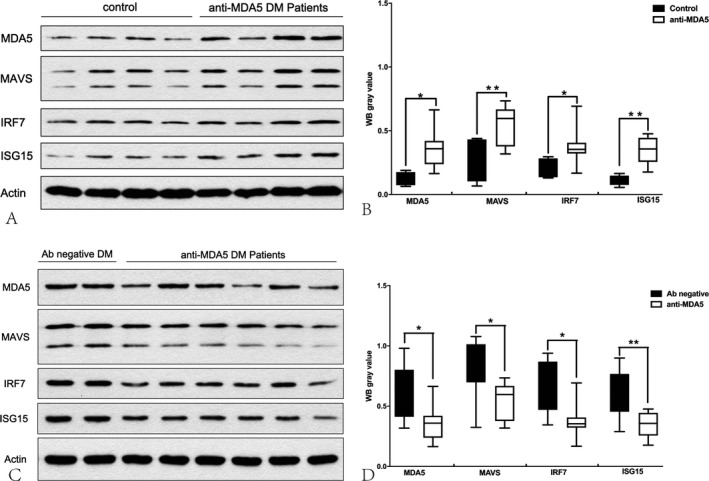
Figure 2.

Protein expression levels of MDA5, MAVS, IRF7, and ISG15 in the skeletal muscle of the anti‐MDA5 patients were significantly higher than those in the healthy controls (A, B) but lower than those in the antibody‐negative DM patients (C, D). Protein expression levels were quantified by densitometric analysis. Actin bands were used as loading control. Data are presented as mean ± SD. Statistical analysis was performed by Student’s t‐test. *P < 0.05, **P < 0.01.
