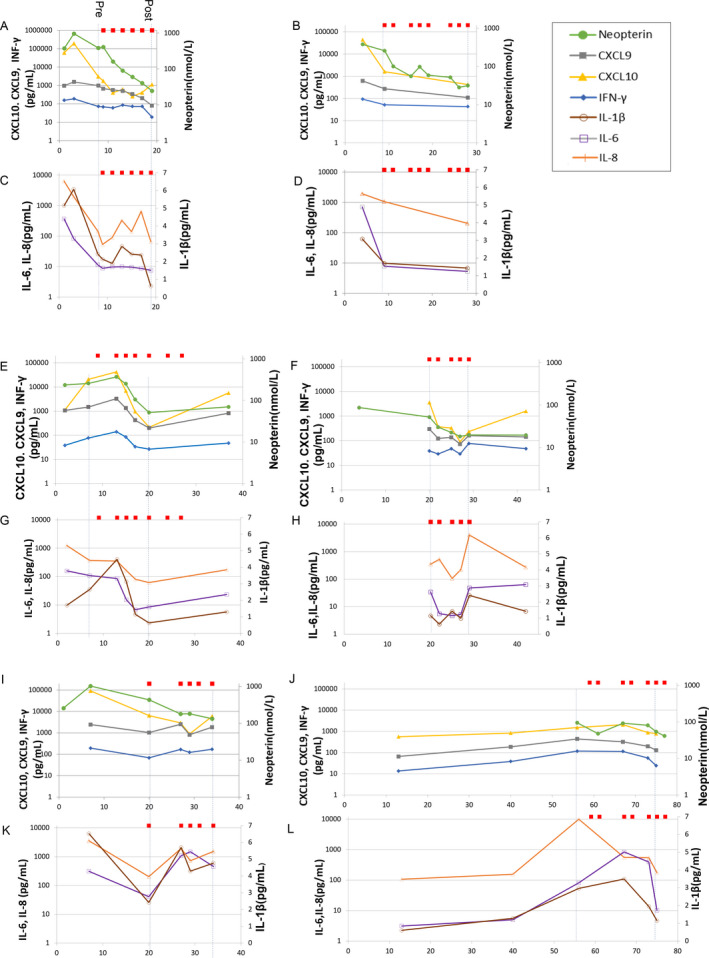
Figure 2.

CSF concentrations of cytokines, chemokines, and neopterin in the six patients with FIRES. Red squares show the administration of IT‐DEX. The x‐axis represents days from the onset of disease. The y‐axis represents CXCL10, CXCL9, IFN‐γ, neopterin, IL‐6, and IL‐8 concentrations presented in log scale (A–L). Patient 1 (A, C); Patient 2 (B, D); Patient 3 (E, G); Patient 4 (F, H); Patient 5 (I, K); and Patient 6 (J, L).
