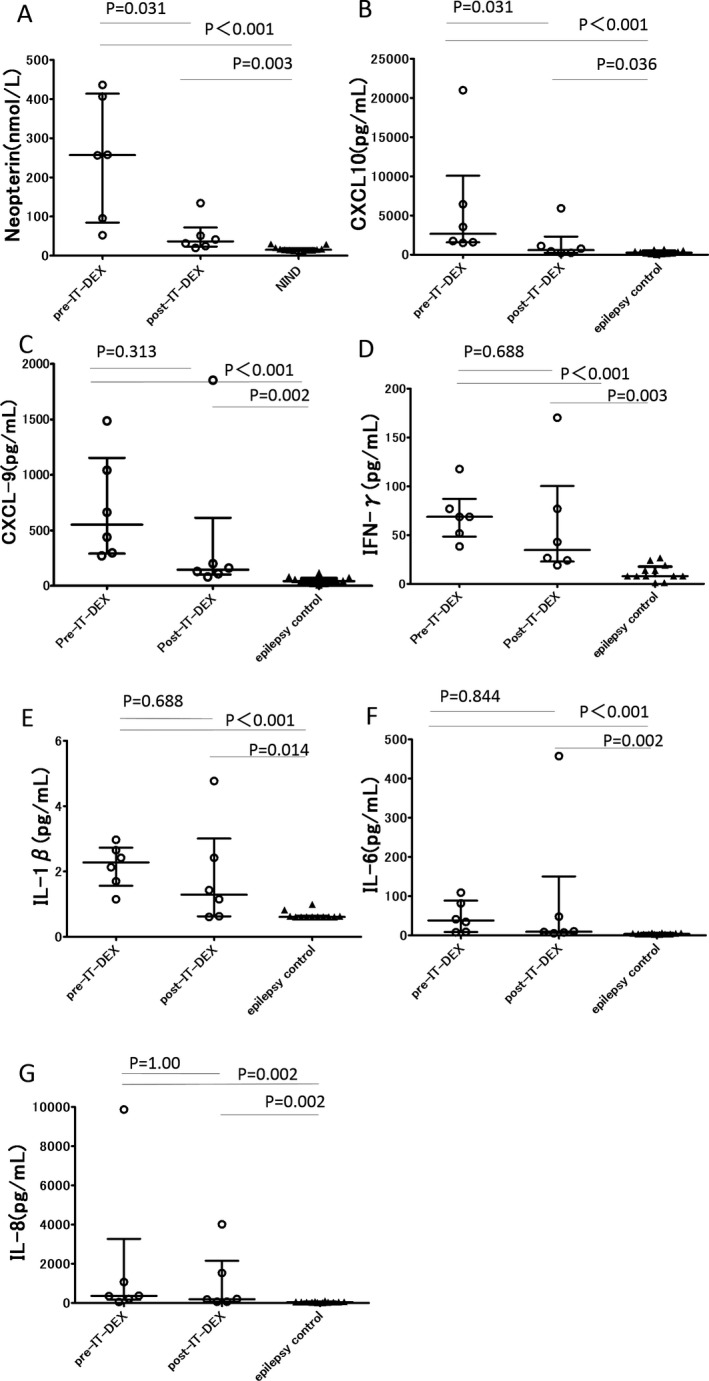
Figure 3.

Proinflammatory cytokine/chemokine and neopterin concentrations in CSF from patients with FIRES and controls. (A): CSF neopterin levels were measured in samples from patients with FIRES and patients with noninflammatory neurological disease (NIND) using HPLC. FIRES, N = 6; NIND, N = 13. (B)–(G): CSF levels of (B) CXCL‐10, (C) CXCL‐9, (D) IFN‐γ, (E) IL‐1β, (F) IL‐6, and (G) IL‐8 measured using a multiplexed immunoassay in samples from patients with FIRES and epilepsy. FIRES, N = 6; Epilepsy, N = 12. Each dot represents the cytokine/chemokine or neopterin levels of each patient. Bars express the median and interquartile range.
