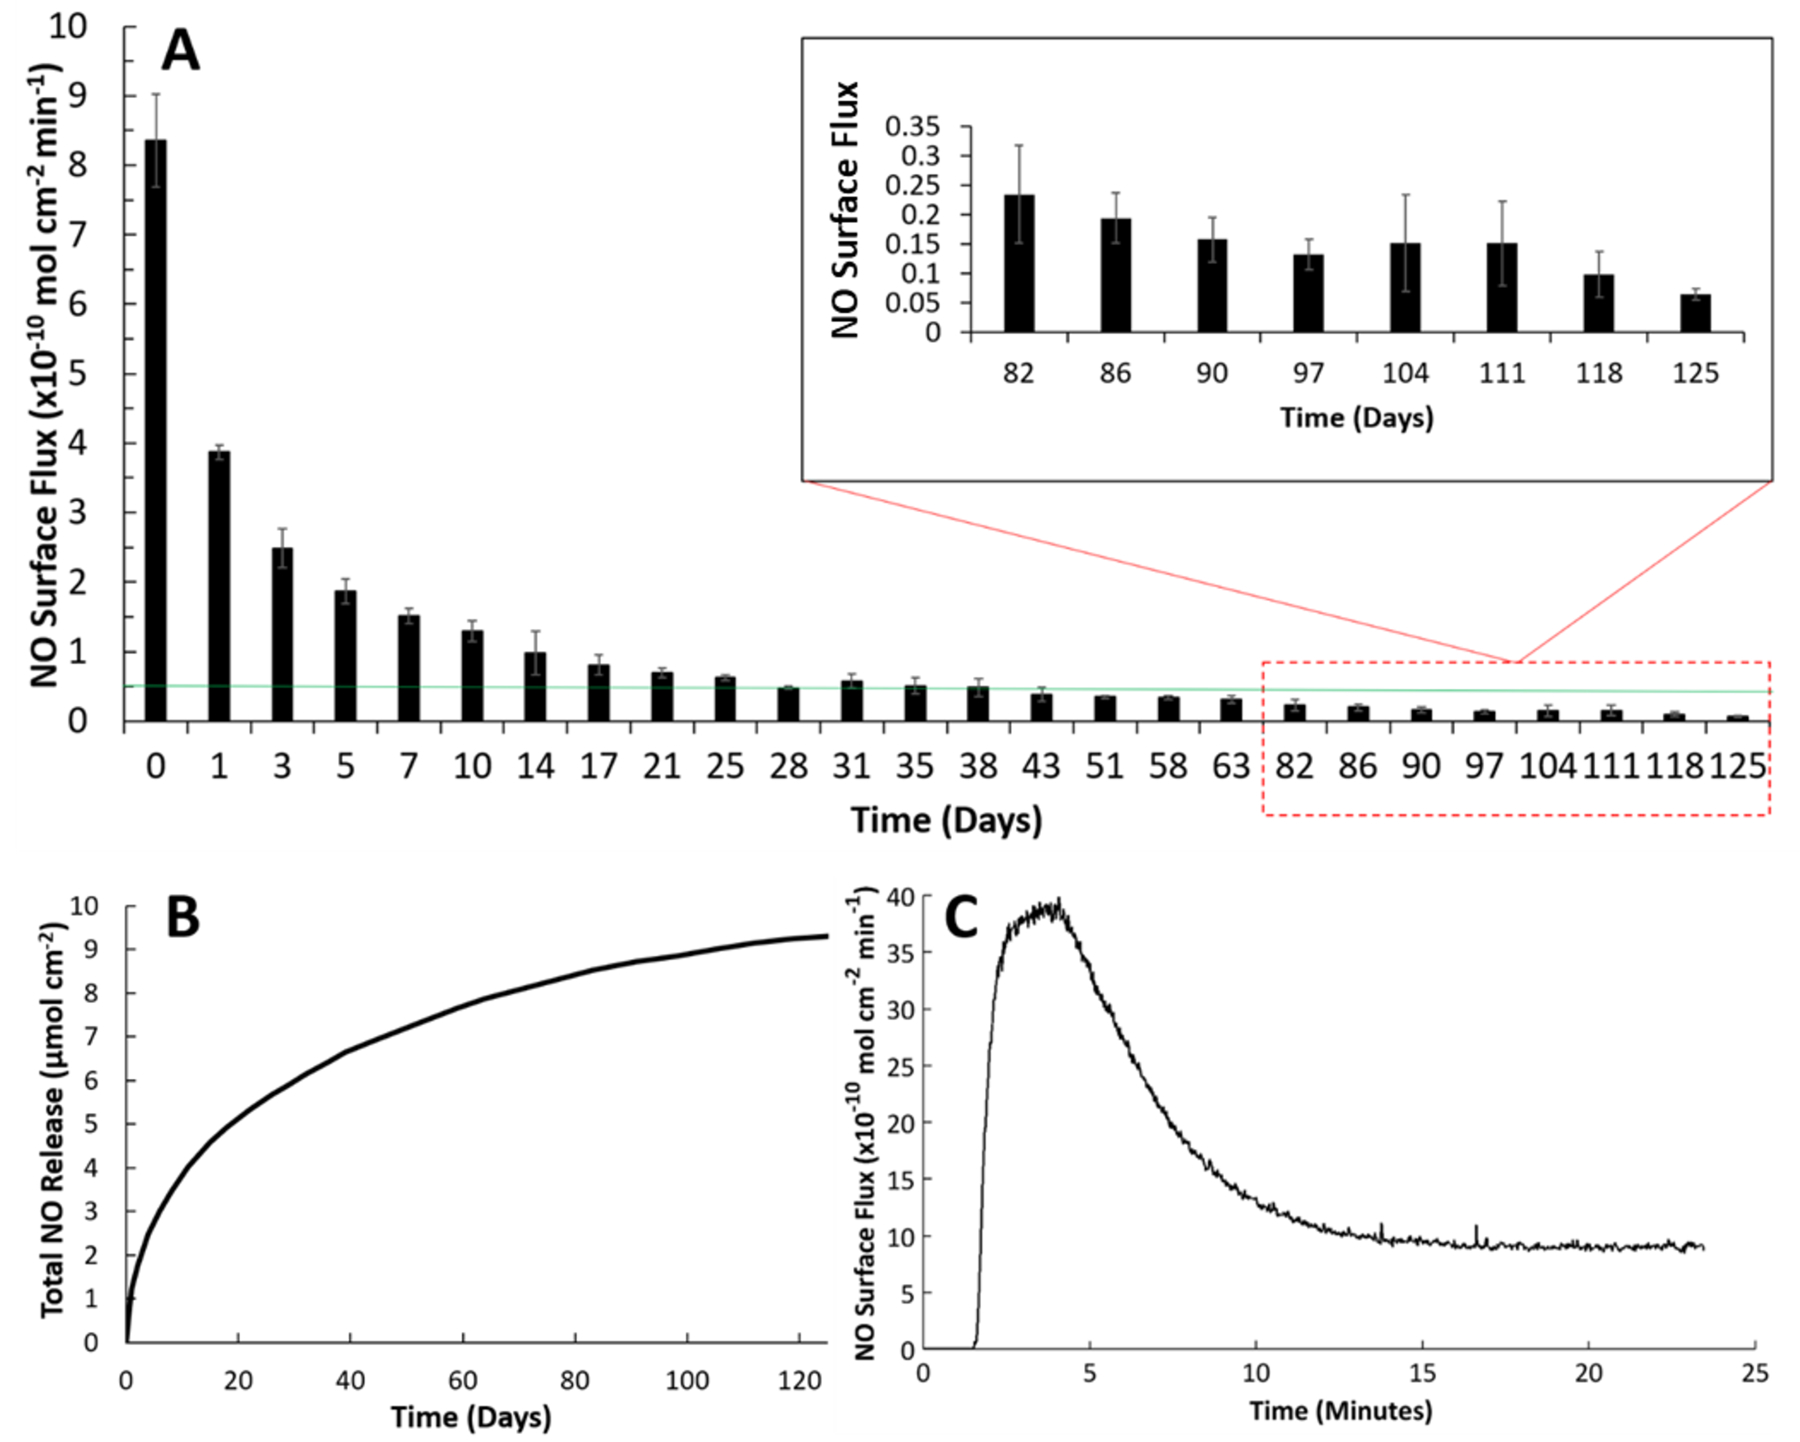
Figure 2.

Nitric oxide releasing kinetics of SNAP-PDMS films where (A) continuous NO release flux measurements were taken on specified days while storing the films in PBS with EDTA at 37 °C (n=4). The green line represents the minimum physiological level of NO flux (0.5 × 10⁻¹⁰ mol cm−2 min−1). (B) Cumulative NO release over the 125-day testing period was measured and normalized per cm2 of SNAP-PDMS. (C) Representative NO release profile on day 0 from SNAP-PDMS films when placed in PBS with EDTA at 37 °C. Error bars represent standard deviation.
