. 2020 May 21;4(1):103–110. doi: 10.1080/24740527.2020.1714431
© 2020 The Author(s). Published with license by Taylor & Francis Group, LLC.
This is an Open Access article distributed under the terms of the Creative Commons Attribution License (http://creativecommons.org/licenses/by/4.0/), which permits unrestricted use, distribution, and reproduction in any medium, provided the original work is properly cited.
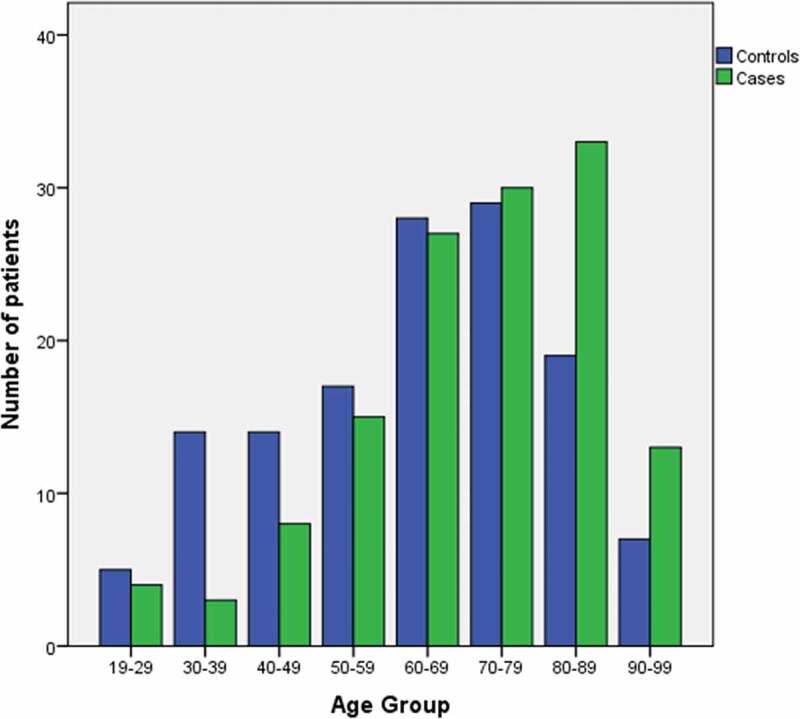
Figure 3.

Distribution of case and control patients according to age groups
