
Figure 3. Dmd C3333Y models progressive muscular dystrophy.
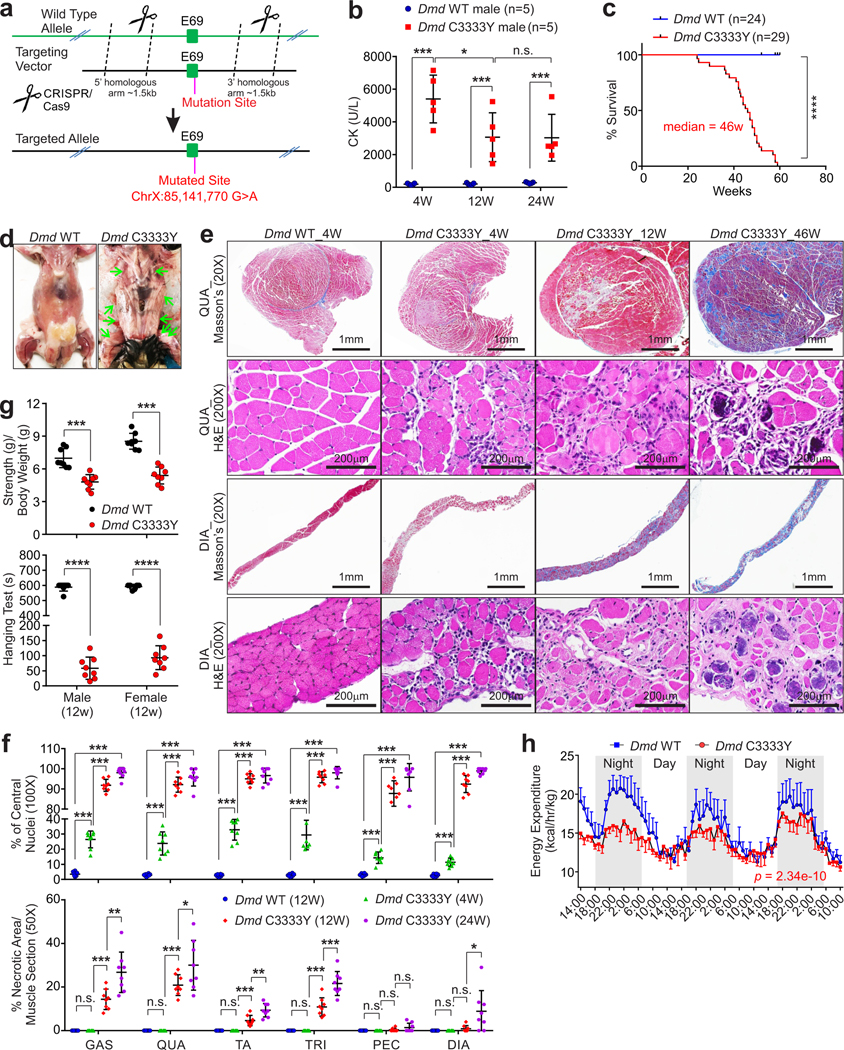
a, Schematic of CRISPR-cas9 method used to generate Dmd C3333Y mice. b, Creatine kinase (CK) concentration comparison of male Dmd C3333Y and Dmd WT mice at indicated ages. Mean values±SD, n=5 animals per experimental group, two-way ANOVA. c, Kaplan-Meier survival analysis of Dmd WT and Dmd C3333Y mice, (n=24 and 29 animals respectively, log rank test). d, Dissection images of the deceased animals indicate the skeleton muscle, respiratory muscle thoroughly calcified, indicated by green arrows. e, Masson’s trichrome staining and H&E staining of quadriceps (QUA) and diaphragm (DIA) of Dmd WT and Dmd C3333Y mice at the indicated age. Scale bars: 1 mm or 200 μm. f, Statistical analysis of percentage of central nucleic muscle fiber (top) and necrotic area of indicated muscle pieces (bottom) of Dmd WT and Dmd C3333Y mice at the indicated ages. GAS: gastrocnemius, QUA: quadriceps, TA: tibialis anterior, TRI: triceps, PEC: pectoralis, DIA: diaphragm. Mean values±SD, n=8 animals per experimental group, two-way ANOVA. g, Muscle strength test (top) and hanging test (bottom) of 12 weeks old male or female Dmd WT and Dmd C3333Y mice. Mean values±SD, n=8 animals per experimental group, unpaired Student’s t-test. h, Energy expenditure measurement of Dmd WT and Dmd C3333Y mice. Mean values±SEM, n=4 animals in each group, two-way ANOVA. No significance [n.s.], p > 0.05, *, p < 0.05, **, p < 0.01, ***, p < 0.001, and ****, p < 0.0001. Statistical source data are provided as Source Data Fig. 3.