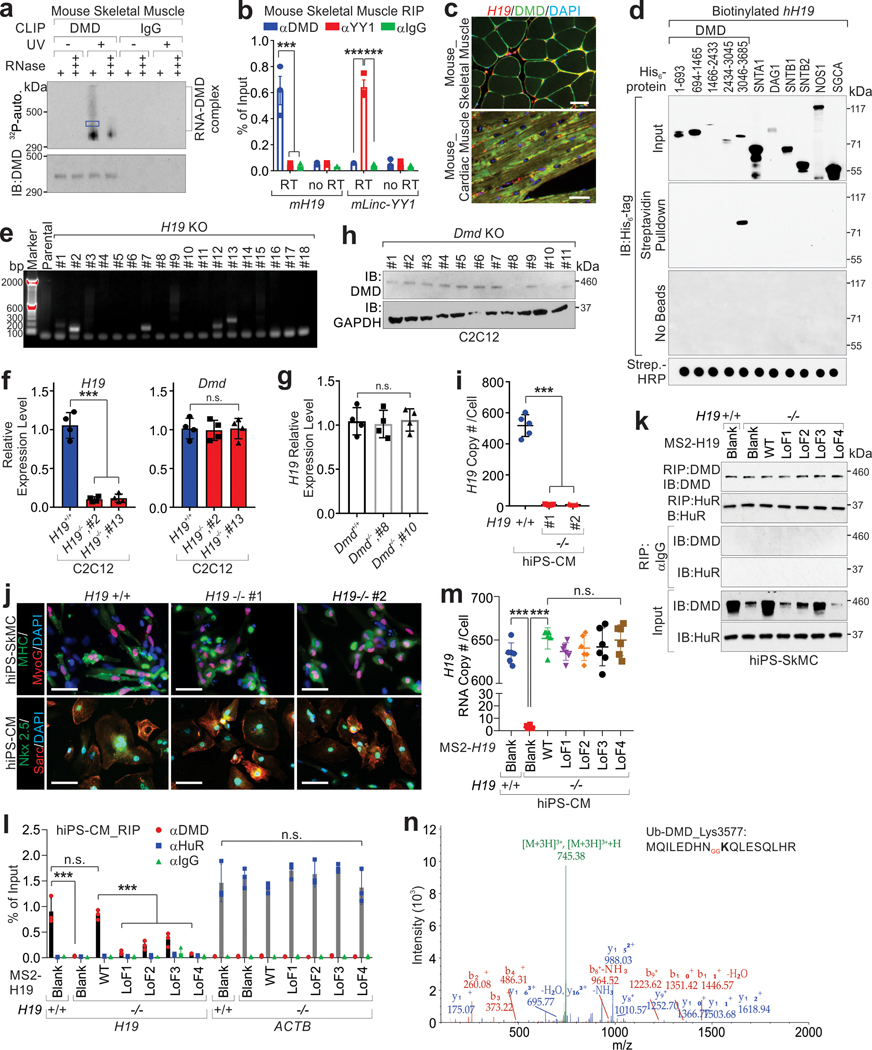
Extended Data Fig. 1. H19 interacts with dystrophin.
a, CLIP assays using mouse skeletal muscle tissues, followed by autoradiography. Protein-bound RNA (blue box) were extracted for Sanger sequencing. b, RIP assay using mouse skeletal muscle tissue. Mean values±SD, n=3 independent experiments, two-way ANOVA. c, Representative images of immune RNA Fluorescence In Situ Hybridization in mouse skeletal and cardiac muscle tissues. Data represents three independent experiments. Scale bars, 50 μm. d, Streptavidin pull-down assay using indicated recombinant protein and biotinylated-H19, followed by immunoblotting (IB). Streptavidin (Strep.)-HRP indicated the presence of biotinylated-H19 transcripts. e, Detection of H19 depletion in C2C12 cells. f, RT-qPCR detection of indicated genes in C2C12 H19-proficient or -KO cell line. Mean values±SD, n=4 independent experiments, one-way ANOVA. g and h, RT-qPCR detection (g) or IB detection (h) in Dmd-proficient or -KO C2C12 cell lines. Mean values±SD (g), n=4 independent experiments, one-way ANOVA. i, H19 Copy number determination in iPS-derived cardiomyocytes (iPS-CMs) using qPCR. Mean values±SD, n=5 independent experiments, one-way ANOVA. j, Representative image of immunofluorescence staining (IF) of iPS-SkMCs and cardiomyocytes (iPS-CMs) derived from healthy donor (GM09503), upon H19 depletion. Scale bars, 50 μm. k and l, IB detection of indicated proteins (k) or RIP assay (l) in H19-proficient or deficient iPS-SkMCs expressing indicated expression vectors. Mean values±SD (l), n=3 independent experiments, two-way ANOVA. m, H19 RNA copy number determination in H19-proficient or deficient iPS-CMs expressing indicated expression vectors. Mean values±SD, n=6 independent experiments, one-way ANOVA. n, Annotated MS/MS spectrum assigned to the dystrophin peptide with ubiquitin modification at Lys 3577. No significance [n.s.], p > 0.05, *, p < 0.05, **, p < 0.01, ***, p < 0.001. Autoradiography and immunoblots are representative of two independent experiments. Statistical source data and unprocessed immunoblots are provided as Source Data Extended Data Fig. 1.

