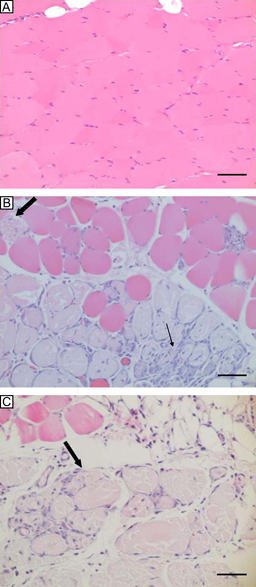
Figure 2.

Transverse slices of HE‐stained abdominal muscle cross‐sections. (A) A control slice shows myofibres with normal appearances (scale bar, 50 μm). (B) Necrotic areas (big arrow) adjacent to normal muscle and massive infiltration of inflammatory cells (small arrow) are observed in the 10‐kg group (scale bar, 50 μm). (C) Larger necrotic areas (big arrow) are seen in the 20‐kg group (scale bar, 50 μm).
